Healthcare in the US is largely reactive. People get sick, go to the emergency department, get treated, and go home. The cost of this cycle is massive, and a significant portion of ED visits are avoidable. If we could identify who is likely to end up in the ED before they get there, we could intervene earlier with preventative care and outreach.
This is the core idea behind predictive analytics in healthcare: use data to find the people who need help before they show up in crisis. But what data do you actually need to make that work? And once you have a prediction, how do you prove that acting on it made a difference?
I built a project around this question using publicly available data to see how far you can get without access to clinical records. It builds on BYU Healthcare Case Competitions that I competed in with my team (shoutout Harrison Nemelka, Gracie King, Colby Clark). I wasn't really interested in healthcare before those competitions, but I got pulled in because the problems are tangible. I see so many companies pushing new AI B2B software and it is nice to work on something truly impacting lives. Winning the competition as the only non-BYU team to ever do it didn't hurt either.
What I Built: A Geographic Risk Dashboard
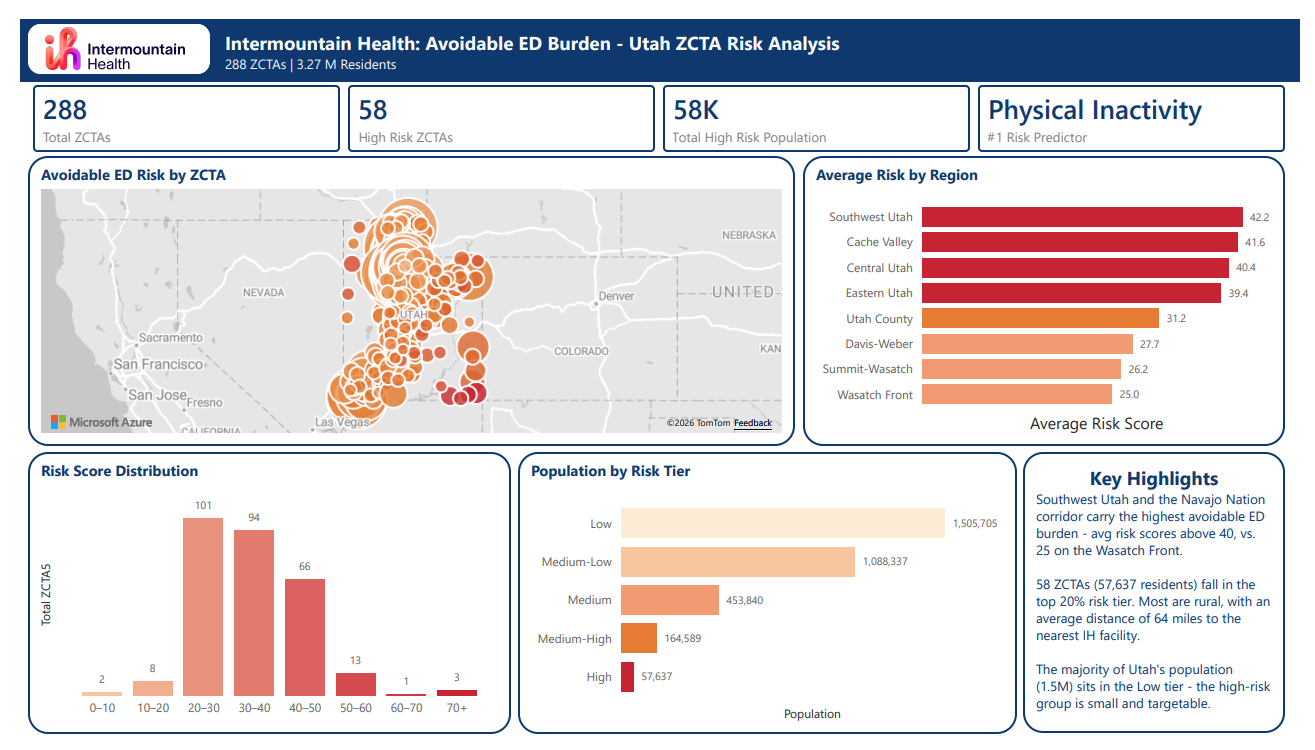
For my project, I built a two-page Power BI dashboard analyzing avoidable ED burden across Utah. The data sources were entirely public: CDC health indicators, US Census demographics, and Intermountain Health facility locations. No patient records, no clinical data. It's inspired by the case competition solutions our team came up with.
The dashboard covers:
- ZCTA-level risk scoring for avoidable ED visits. ZCTAs (Zip Code Tabulation Areas) are the Census Bureau's version of zip codes, built for statistical analysis. They let you map health and demographic data down to a neighborhood level.
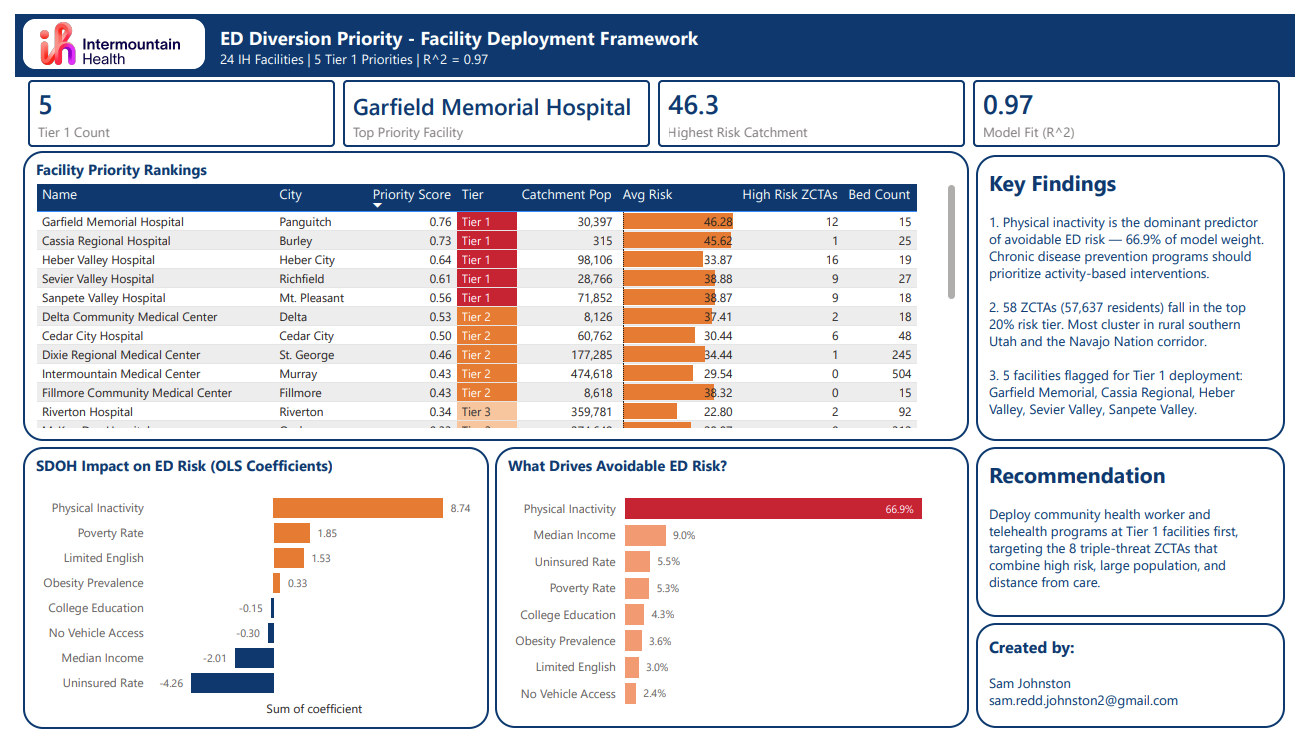
- SDOH drivers and their relative contribution to risk. SDOH stands for Social Determinants of Health, which are the non-clinical factors that influence health outcomes: things like poverty, insurance coverage, education, transportation, and access to care. The idea is that where someone lives and the conditions of their community can predict health risk just as well as (or better than) their medical history.
- A facility deployment framework for prioritizing where community health interventions would have the most impact
The goal is to identify which communities are at the highest risk and where resources should be directed first.
Download Dashboard PDF
The model had a very strong fit (R² = 0.97), meaning SDOH data alone explained nearly all of the variation in avoidable ED risk across Utah. The standout finding was that physical inactivity was the dominant predictor, accounting for 66.9% of the model's weight. The gap between physical inactivity and the second-strongest predictor (median income at 9%) was massive.
Geographically, the highest-risk regions were all rural. The Wasatch Front, where most of Utah's population lives, had the lowest risk scores. The 58 high-risk ZCTAs averaged 64.4 miles from the nearest Intermountain facility, compared to just 6.2 miles for the low-risk tier. Those same communities had double the poverty rate and double the diabetes prevalence compared to low-risk areas. Barriers to care like poverty and distance led to worse health outcomes. It makes logical sense, but it's still nice to see it spelled out in numbers.
The Data Spectrum: From Public to Clinical
One of the most interesting things I found while researching this topic is how much predictive power you can get without clinical data, and how much more you gain as you layer it on.
Tier 1: Public Data Only (My Project's Data)
Using only publicly available data (CDC, Census, facility locations), you can identify geographic hotspots and the SDOH factors driving risk at the community level. This is the starting point any health system could use today without any special data access. The only problem is that you are just getting a general zip code area. You know where the problem is, but not exactly who within that area needs help.
Tier 2: Public SDOH + Behavioral Data (No Clinical Records)
Chen et al. (2020) took the next step. They used publicly available SDOH data combined with purchasable behavioral data to predict individual-level ED and inpatient utilization. No clinical records. Their model achieved high accuracy (AUC of 0.83-0.84) across 138,115 patients in three health systems spanning urban Ohio, urban Georgia, and rural Alabama.
What makes their findings remarkable is the feature importance ranking. Air quality was the single strongest predictor of healthcare utilization, followed by income and neighborhood in-migration. Traditional demographics like age, race, and gender ranked near the bottom. This challenges the assumption that you need a patient's medical chart to know who is at risk. Where someone lives and the socioeconomic conditions of their neighborhood tell you a surprising amount.
I found something similar in my analysis where physical inactivity dominated my model at 66.9% importance, with median income a distant second at 9%. Both studies show that behavioral and environmental factors can be much more effective at identifying high risk areas than just demographics alone.
Tier 3: Full Clinical Claims Data
David et al. (2019) used the richest data available: full insurance claims from Independence Blue Cross covering 29,222 Medicare Advantage members with congestive heart failure. Their model used over 500 features derived from medical and pharmacy claims, lab results, customer service contacts, clinical alerts, demographic information, and even natural language processing of customer call notes.
With this level of data, you go from neighborhoods to individual patients. You can generate risk scores precise enough to drive targeted outreach, and you know exactly why someone is at risk, which means you know what services could actually help them.
What This Means
Each layer of data makes the model more precise, but even the most basic publicly available data identifies meaningful patterns. It isn't going to tell you exactly who to call, what to say, or what needs to be done, but it can give valuable insight into what areas need help the most. Even if you look at it in business terms, this is technically an "untapped market" that will save hospitals lots of money on unnecessary ED visits.
Does It Actually Work? Measuring Intervention Effectiveness
Building a risk model is one thing. Proving that acting on it actually reduces ED visits is another. This is where most conversations about predictive analytics in healthcare stop, but it's the most important part. This is often referred to as "closing the loop." You make an observation, tweak something, and then measure and validate that the change actually improved things.
The Challenge of Measurement
You can't run a traditional A/B test in healthcare the same way you would in e-commerce. You can't ethically withhold care from a control group. "We identified you as high-risk but decided not to help you so we could measure the difference" is not an option.
So researchers use quasi-experimental designs that take advantage of natural or arbitrary cutoffs to create comparison groups.
How David et al. Proved Causality
The David et al. (2019) study used a regression discontinuity (RD) design. Here's how it worked:
Every time the algorithm ran, it ranked all members by risk score from highest to lowest. The care management team then decided how many people they had capacity to reach out to. If they could handle 200, then person #200 got a phone call from a nurse health coach and person #201 did not, despite having a nearly identical risk score.
That arbitrary, resource-driven cutoff is what creates the natural experiment. People just above and just below the threshold are statistically identical in every way except whether they received the intervention. Any difference in outcomes between those two groups can be attributed to the outreach, not pre-existing differences.
The Results
The intervention, which consisted of registered nurse health coaches calling high-risk members to identify gaps in care and coordinate treatment, produced significant results:
- ED visits decreased by approximately 40% within the first year for the treatment group
- Cardiologist visits decreased by about 27% over 360 days
- PCP visits and hospitalizations showed no statistically significant change
That last point is worth noting. The outreach reduced expensive, reactive care (ED and specialist visits) but didn't increase primary care visits, which is what you'd ideally want. The intervention caught people before they hit the emergency department, but didn't necessarily shift them toward ongoing preventative care with a primary care physician.
What We Still Don't Know
The study used an intent-to-treat approach, meaning everyone above the cutoff was counted as "treated" regardless of whether they actually picked up the phone or enrolled in care management. So the 40% reduction is actually a conservative estimate since it includes people who were never actually reached.
They also couldn't isolate which component of the intervention drove the result. Was it simply being told you're high-risk that changed behavior? Was it the nurse coaching? The care coordination? The study acknowledges this limitation. Continued tracking, targeted surveys, or follow-up interviews could help answer that question and improve the model over time.
Connecting It Back: What This Means for Health Systems
The research supports a clear framework:
- Identify risk using whatever data you have available. Public data gets you geographic targeting. SDOH and behavioral data gets you closer to individual risk. Clinical data gets you precise enough to know specific individuals and needs.
- Intervene with human outreach. The model can identify specific people with a fair amount of accuracy, but nothing will change without human outreach. Nurse health coaches, care coordinators, community health workers are the actual intervention. A risk score in a dashboard does nothing if nobody acts on it.
- Measure the impact using rigorous evaluation methods. Regression discontinuity, difference-in-differences, interrupted time series. You need to prove the intervention worked, not just that the model was accurate.
This is the same point I made in my first blog post about student retention: data is not a solution, it is informative and allows you to make better decisions. Whether it's predicting which students will drop out or which patients will end up in the ED, the prediction is only valuable if it connects to a human response.
In our healthcare case competitions, our coach Heather Thiesset helped me realize that when you are looking at this type of data, those numbers are real people. Every decision a healthcare leader makes impacts someone's life. Data helps them know that the decision they are making is the right one, and allows them to back it up with evidence. The judges at those competitions spoke about the struggles their own communities were facing. Mental health, chronic illness, all of it could be improved through better prevention strategies. That's what makes this work worth doing.
Thanks for reading.
Sources
- David, G., Smith-McLallen, A., & Ukert, B. (2019). The effect of predictive analytics-driven interventions on healthcare utilization. Journal of Health Economics, 64, 68-79.
- Chen, S., Bergman, D., Miller, K., Kavanagh, A., Frownfelter, J., & Showalter, J. (2020). Using applied machine learning to predict healthcare utilization based on socioeconomic determinants of care. American Journal of Managed Care, 26(1), 26-31.
- Chi, W., Andreyeva, E., Zhang, Y., Kaushal, R., & Haynes, K. (2021). Neighborhood-level social determinants of health improve prediction of preventable hospitalization and emergency department visits beyond claims history. Population Health Management, 24(6), 701-709.